What is a histogram?
Think of it as a “brightness report card” for your photo — it shows whether your image is too dark, too bright, or just right.
Real-life analogy
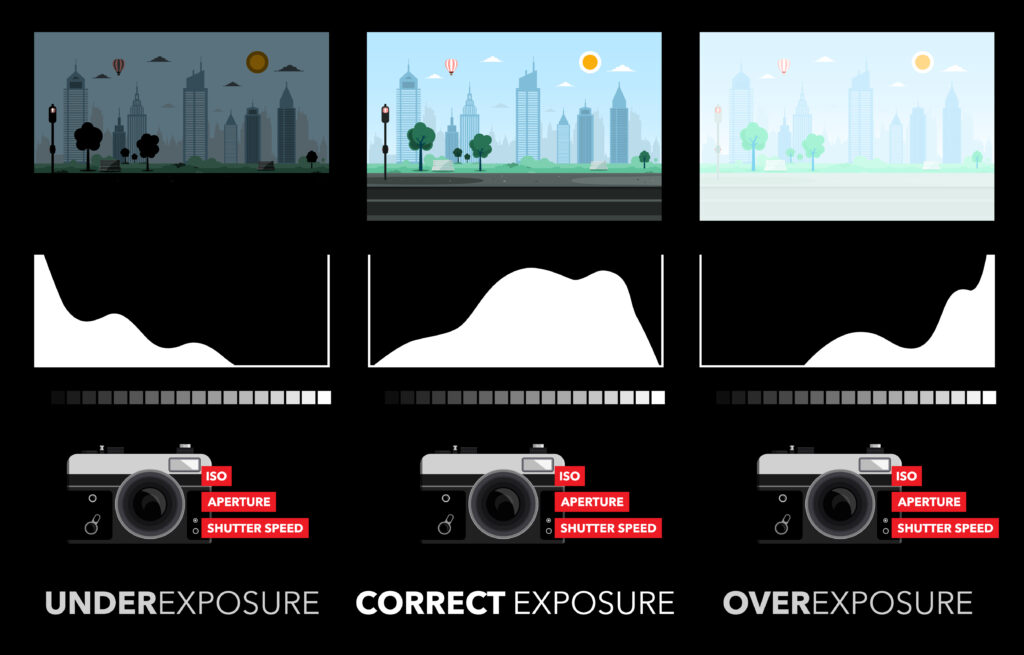
Imagine sorting all the pixels in your photo into buckets by brightness — from pitch black on the left to blinding white on the right. The histogram is just a bar graph of those buckets. Tall bars = lots of pixels at that brightness. Short bars = fewer pixels.
The one rule to remember
- Look at the left edge – If the graph is smashed against the left wall and cut off, your dark areas are pure black — no detail, no texture. This is called “shadow clipping.” It’s like your shadows fell into a black hole.
- Look at the right edge – If the graph is smashed against the right wall and cut off, your bright areas are pure white — completely blown out. This is “highlight clipping.” Sky with no clouds, white shirt with no wrinkles — just blank white.
- The goal: nothing falls off either edge – If your histogram fits entirely within the frame (no walls), every brightness in the scene was recorded. You can fix minor issues in editing. Once pixels are clipped, that detail is gone forever — you can’t recover it.